The history of the stock market reveals how specific patterns
come into being, and how it influences subsequent behavior. Pattern sequences of
a previous time are reborn and under the right circumstances, can identically
repeat. It is simply a reproduction of how investors are behaving collectively
at two different points in time. But knowing that a pattern has a particular script it
follows can constitute a path that holds (or leads to) a likely outcome!
Ninety percent of the time all market declines will have
two panics. The first is associated with volume and volatility, invoking
maximum participation. The second is a byproduct of the first and unfolds in a final
‘flush out.’ It is less dramatic in size and influence- but prices reach new
lows.
Time is also a component and is equally as
important. Once a protracted decline sets in, historically there is not a
typical short squeeze of five to eight percent in the other direction, but a
tremendous upward spike which reverses the trend all together.
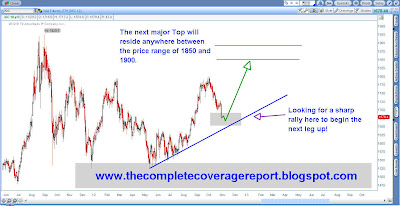
The modern day scenario that is most fitting is of
course, the GOLD MINING INDEX. And after an extended three month correction, we
can officially say "the rubber band has been stretched!" The technical picture provides
enough evidence to define a clear cut two- panic low sequence, but more
interestingly, the second panic has a particularly complex nature that morphed
into a sideways and seemingly base pattern. This now calls for a violent uptrend underway!
GDX-Daily Chart (click to enlarge)
The CC Report offers two subscriptions-
$9.95/month or $100/year. It is well worth the information received.
Darah


